Many input formats
Directly load the following formats: Microsoft Excel files (XLS and XLSX), ASCII fields delimited files, AERMOD surface meteorological files, CALMET 5.8 and CALMET 6 surface meteorological files, ISC3ST meteorological files, TD-1440 meteorological files, EnergyPlus Weather files, Typical Meteorological Year files (TMY2 and TMY3), NOAA ISH (Integrated Surface Hourly) or ISD (Integrated Surface Data), ASCII files with frequencies
Different types of plots
Different plot types can be created: wind roses, raw data, rays and minimum/average/maximum/percentiles plots. The percentile plot, which represents a specified percentile of the values along each direction, may be useful for example for pollution roses.
When a third variable is loaded - only with Excel input files - ternary plots may also be created.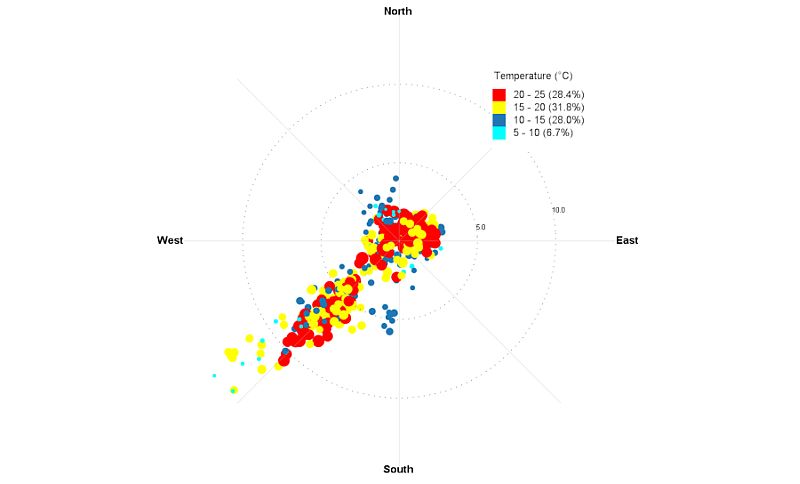
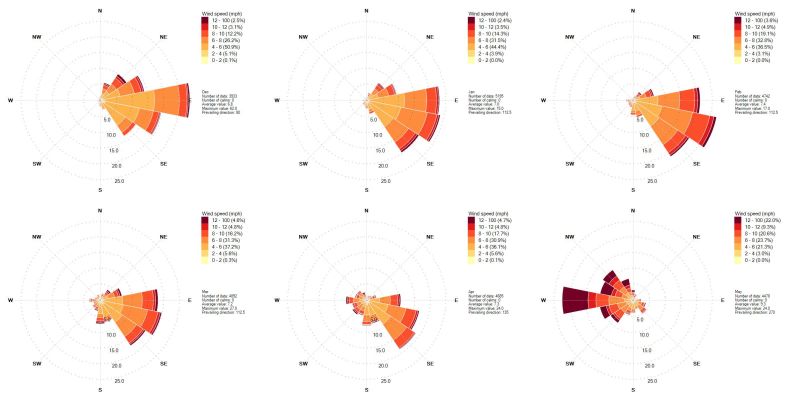
Batch processing
Automatically generates hourly, three-hourly and monthly wind roses starting from a single input file. Date/time filtering specified by the user are automatically applied during the batch processing. Output images can be created as BMP, JPG or PNG. All the plots are saved in an output directory specified by the user.
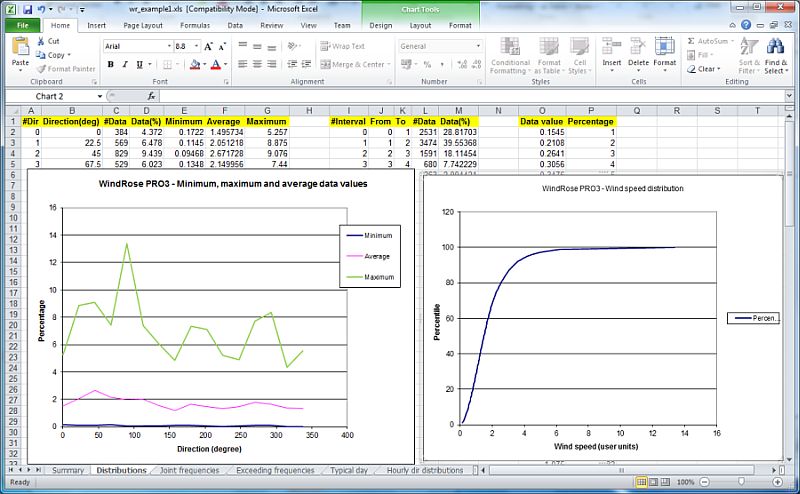
Export statistics and charts in Excel
Exports statistics in Microsoft Excel files. Charts are automatically created within the Excel file. Depending on the input data the exported Excel file may have a different number of worksheets, including for example, data distribution, exceeding frequencies, joint frequencies, circular statistics, typical day, average hourly direction distribbution and others.
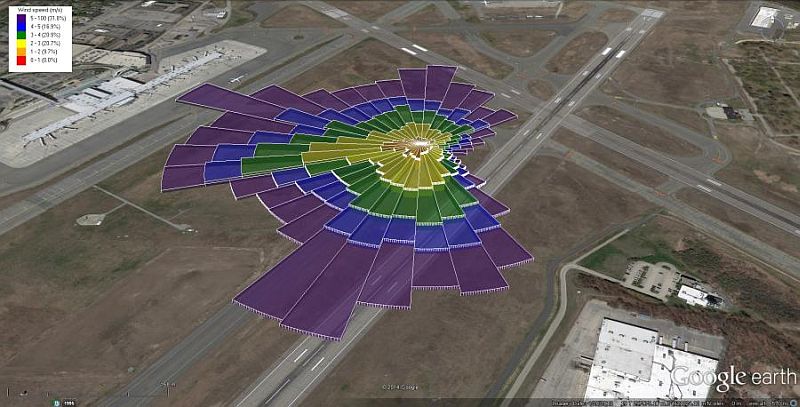
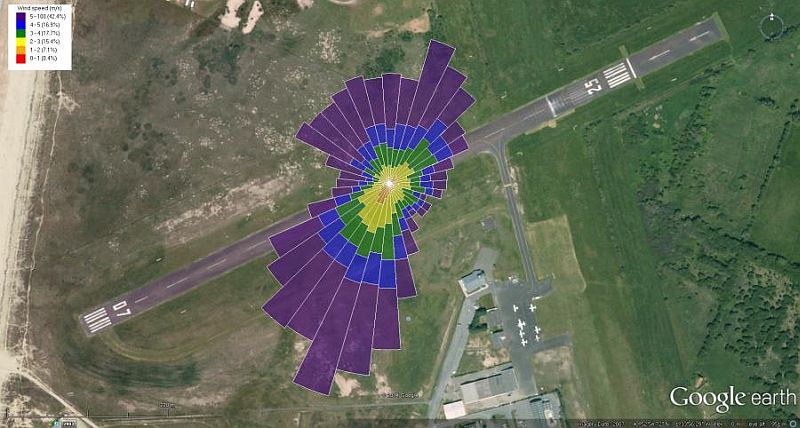
Export wind roses in KML format
Exports wind roses in plain KML format. Exported files can be viewed in Google Earth.
Date/time filtering
Apply date/time filtering to your data in order to exclude specifica years, months, days of the week or hours of the day. Automatically filter day/night hours that are determined by the geographical position.
Wind power
Determine the wind power potential of a location. Create the database of your wind turbines, select one of them and estimate the annual energy production, calculate the parameters of the Weibull distribution, calculate the operating probability, the capacity factors and other parameters.
Crosswind and headwind
Determine distributions of crosswind and headwind components with respect to a specific direction. This feature may be useful, for example, for analyzing wind data for the correct orientation of airport runways.
Aeolian transport
Aeolian sediment transport is important for the evolution of landscapes as well as the formation of sedimentary deposits in the geologic record. Aeolian transport and the formation of sand dunes is a function of the availability of transportable sediment, the net evaporation–precipitation of a given region, and the magnitude and variability of surface wind fields. WindRose PRO3 calculates drift potential (DP), resultant drift potential (RDP) and resultant drift direction (RDD).
Full customization of your plots
Wind rose plots can be fully customized by specifying the number of directions, the number of data intervals and their colors, adding a legend, adding a title, a subtitle and notes and positioning them on the chart by dragging.
Other features
Optionally calculate autocorrelation and structure functions (results exported in thhe Excel file). Determine the erosion potential according to the AP42 methodology. Rotate direction of 180 degree (to adjust from flow vector to wind direction or viceversa). Automatically create a written summary of the analysis in order to speed up the production of your report.