Administrative Questions
Can I move the license from a PC to another one? Yes, provided you deactivate the license on the first PC and re-activate it on the second one.
How can I move the license from a PC to another one? Under the Help menu there is the possibility to deactivate the license from the current PC. Then you need to activate it on another one.
How can I renew the subscription? You will receive a reminder some days before its expiration. You can use the safe link within the reminder message to renew the subscription.
What about technical support and software update? You can get software updates and technical support via email while you have an active subscription.
Technical Questions
Is it possible to use WindRose PRO3 under Mac? No. Also we do not guarantee the correct behaviour of the software in any Windows emulator of Mac.
The software still appears in evaluation mode after applying the permanent license. The permanent license alone is not enough if you apply it to the evaluation version of the software. You need to download the full version of the software from the link sent you after the purchase.
How can I change the position of legend and title? Simply click and drag them on the display. Click on the title with the right mouse button to modify it in a quick way.
How can I create a ternary plot? A ternary plot (or three variables plot) is a polar coordinate chart where the distance of each point from the center (pole) is determined by the wind speed, the angle from north in clockwise direction is determined by the wind direction, and the color and/or size of each point depends on the value of a third variable (e.g., atmospheric temperature, concentration of a specific pollutant, etc.). The ternary plot can be created only if the input data are within Excel files. Try to create a ternary plot with the sample.xlsx file distributed with WindRose PRO3. Follow these steps:
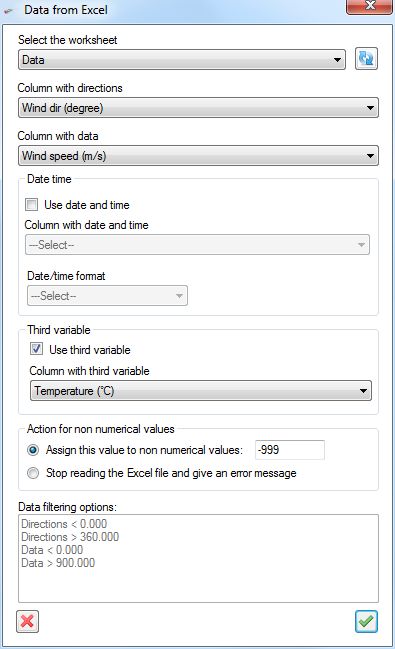
1) Click "File | Load data" and load the data in sample.xlsx as shown in the following figure. Remember to select Temperature as third variable.
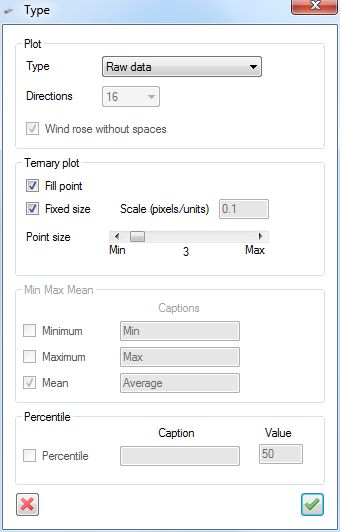
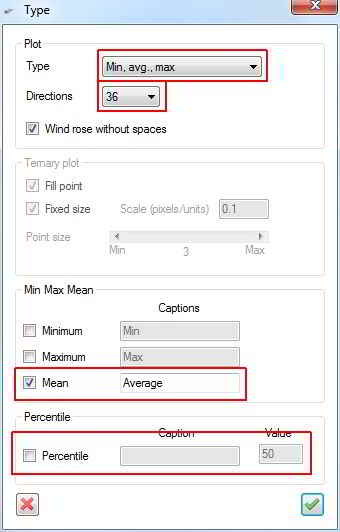
2) Click "Options | Types" and fill in the form as shown in the following figure.
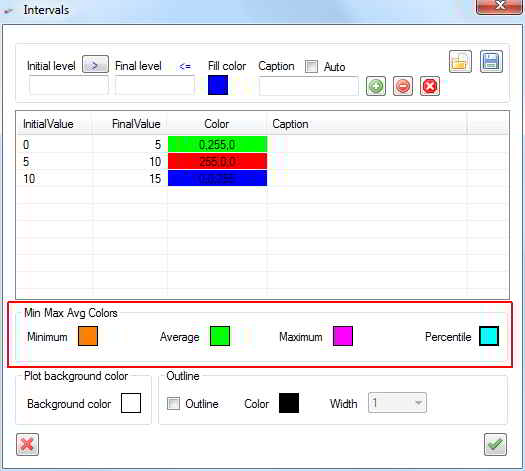
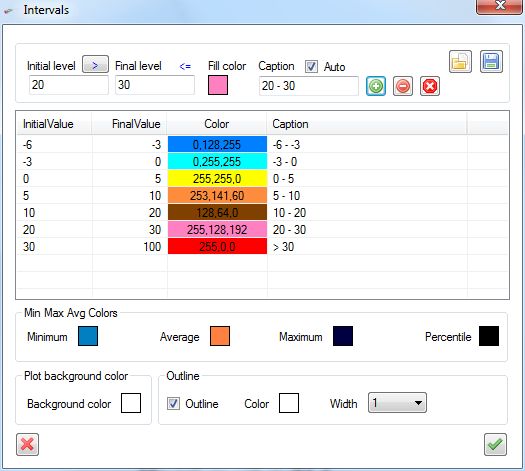
3) Click "Options |Intervals" and set intervals and colors according to the values of your data (see the following figure as an example). Remember that in this form you are inserting values of the third variable (temperature).
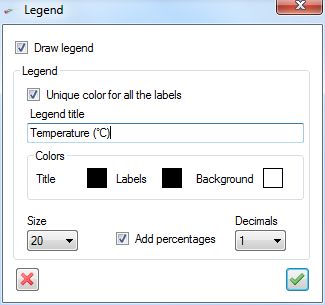
4) Click "Options | Legend" and write a title for the legend, see the following figure.
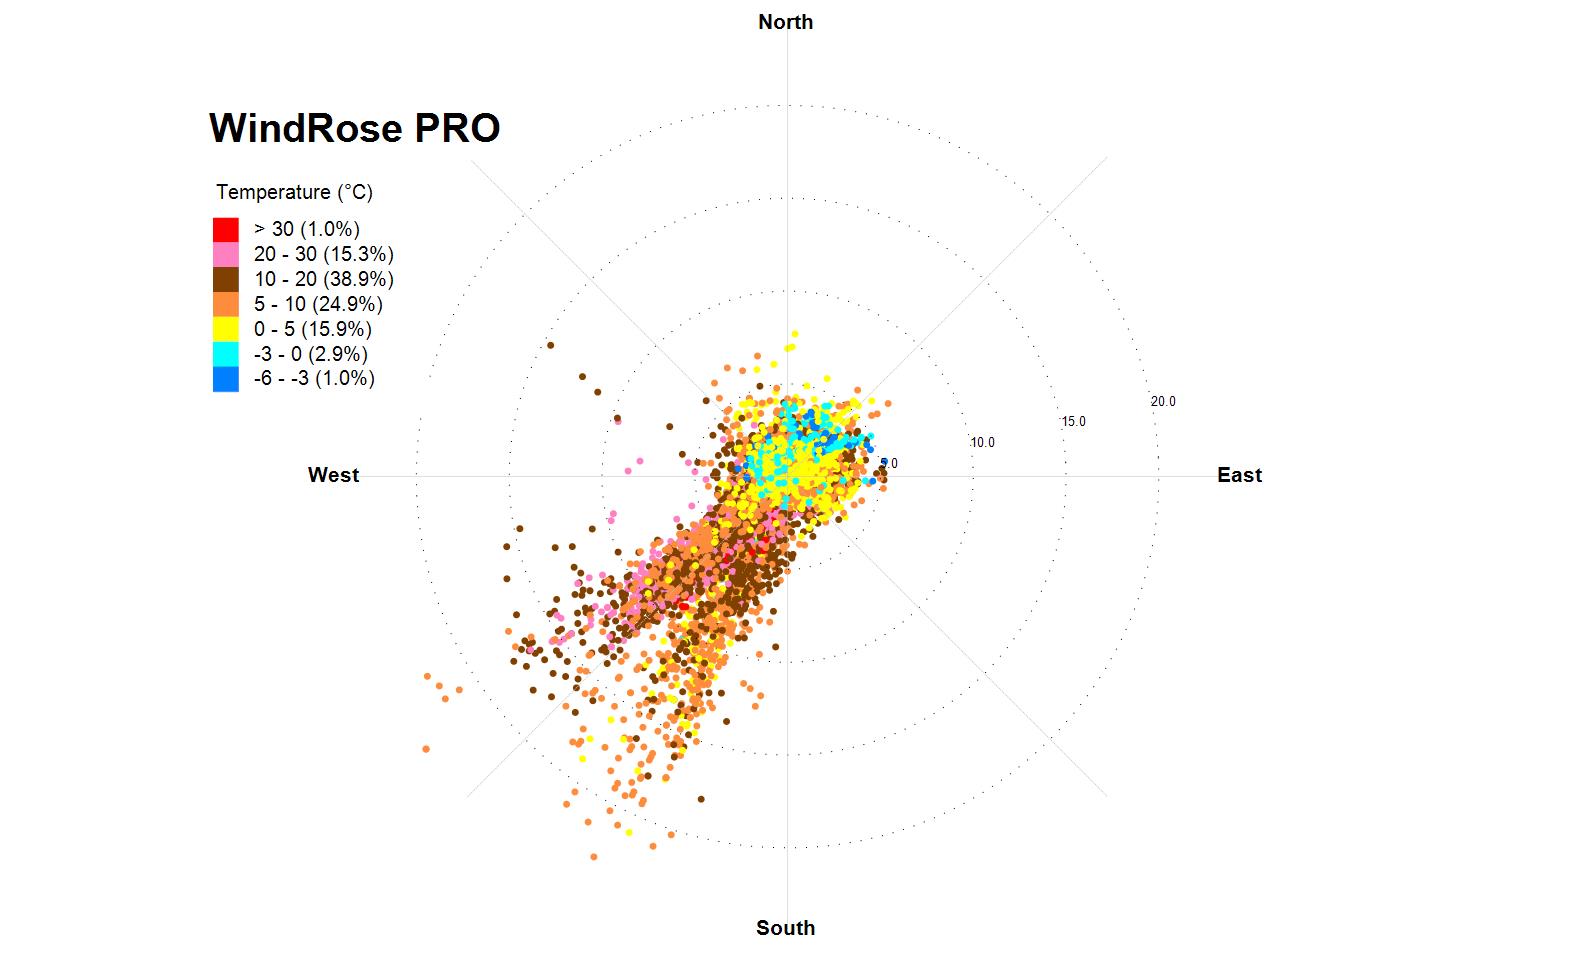
5) Click "Actions | Analyse" and "Actions | Draw". Your plot will look as the following one.
Is it possible to create a pollution rose? Yes, it is. Load your data from a file in one of the several possible formats. Select the fields containing wind direction and concentration levels. Once you have loaded your data go to "Options | Types", and you will see the form represented in the following image. You can modify the options to instruct WindRose PRO3 to produce different types of charts (wind rose, raw data, min/max/avg). For a pollution rose select "Min, avg, max" from the first list. Then select "36" directions in order to have sectors of 10 degrees (you can select any number of directions, according to your needs). In the lower part of the form select "Mean" in order to produce the averages along each direction (you can also select "Minimum" and/or "Maximum" if their representation is useful for you). With these settings the software will create a pollution rose with the average concentration along each direction.
You can also represent a specified percentile of your concentration data along each direction. For example, by selecting "Percentile" and specifying a value of 50 you can represent the medians of the concentrations along each direction. Then go to "Options | Intervals" to define the colors of the pollution rose.